
Heikin Ashi: How to Smooth Your Charts

Heikin Ashi charts filter out market noise, highlight trend strength, and provide a calmer, clearer perspective for smarter trading decisions.
The Art and Power of Fibonacci Trading
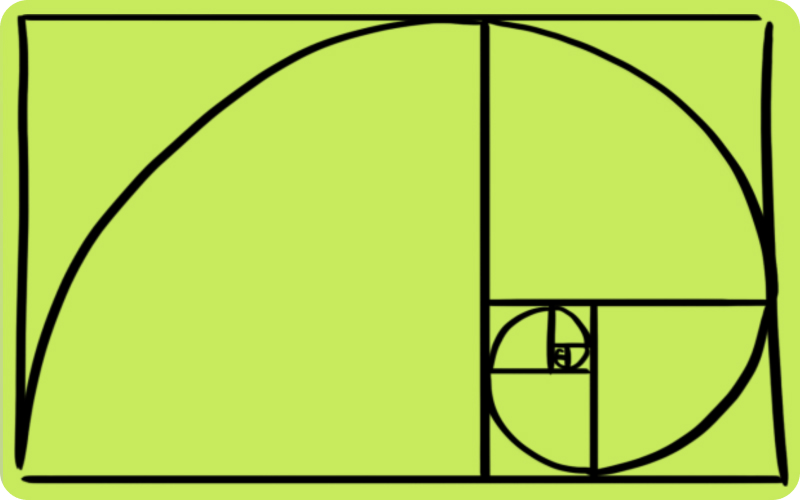
Learn how to use Fibonacci retracement and extension levels to identify trend reversals, spot entry and exit points, and enhance your trading strategy—applicable across forex, stocks, crypto, and more.
Static vs. Trailing Maximum Drawdown – What’s the Difference?
Explore the significance of Fractals indicator in financial markets. Learn to identify potential market reversals and trends.
Indicators – Fractals

Explore the significance of Fractals indicator in financial markets. Learn to identify potential market reversals and trends.
Indicators – Average Directional Movement Index (ADX)
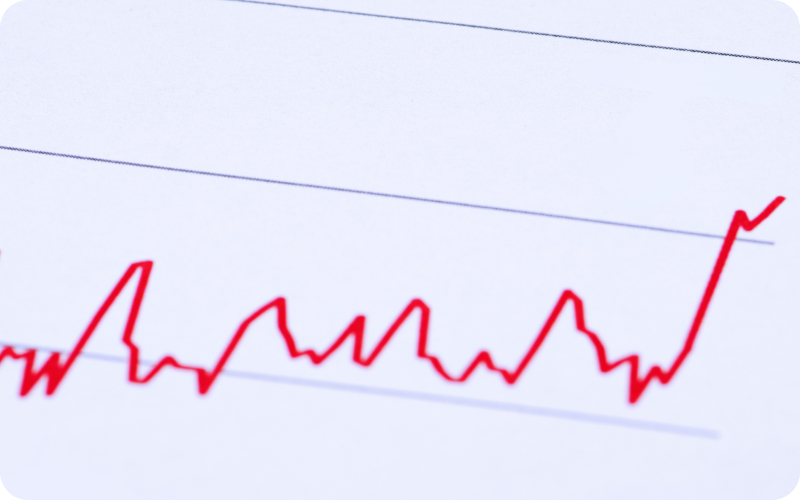
Master the Average Directional Movement Index to boost your trading performance by quantifying the strength of market trends.
Indicators – Bollinger Bands
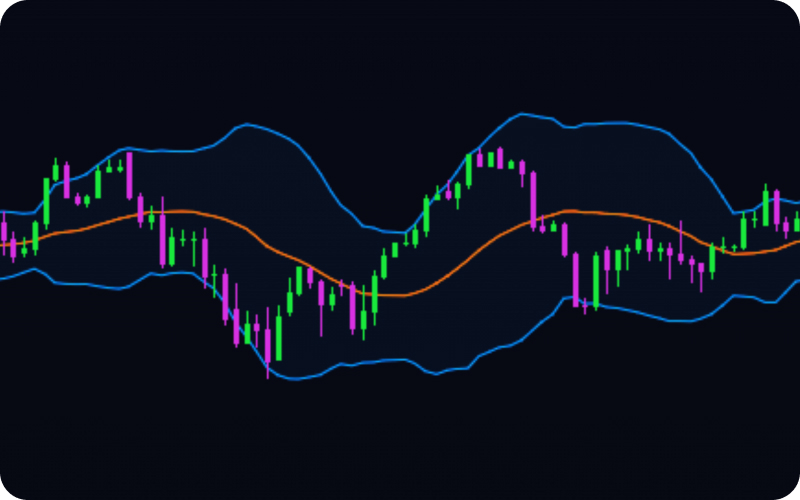
Understand the key features of Indicators Bollinger Bands and their role in technical analysis for effective trading strategies.
Indicators – Moving Average Convergence Divergence
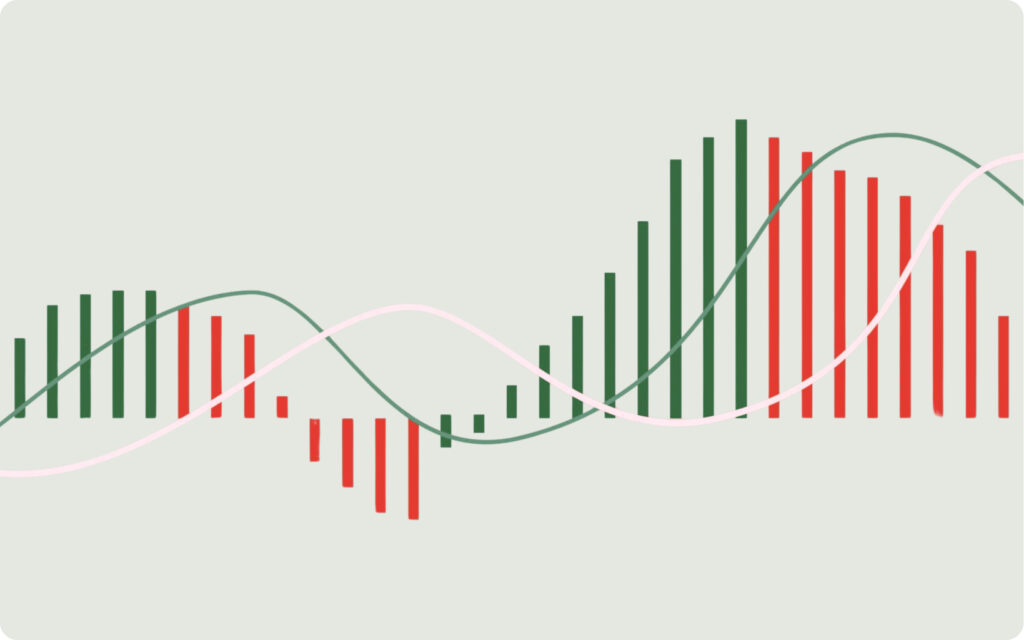
Master the MACD indicator—an essential tool for technical analysis. Learn how to use crossovers, histograms, and divergences to enhance your trading strategies.
Best Emerging Prop Trading Firm for MEA 2025

thePropTrade has been recognized with the award best prom firm for MEA 2025, highlighting our commitment to trader success.
Indicators – Relative Strength Index (RSI)
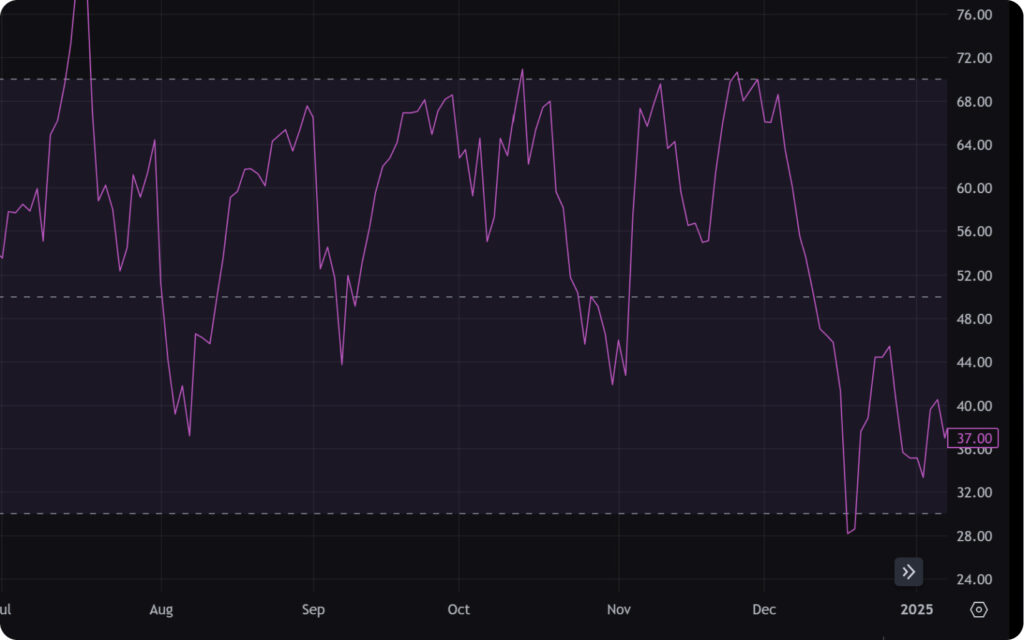
Another incredible tool among technical indicators – Parabolic SAR (Stop and Reverse), a trend-following momentum indicator. Discover its benefits, drawbacks, and practical applications.
Indicators – Moving Averages

Master the MACD indicator—an essential tool for technical analysis. Learn how to use crossovers, histograms, and divergences to enhance your trading strategies.