Another incredible tool among technical indicators is the Parabolic SAR (Stop and Reverse), a trend-following momentum indicator. Created in 1978 by J. Welles Wilder, who also developed the RSI and ATR, the Parabolic SAR provides clear and actionable insights for traders aiming to optimize their entry and exit points.
The History of the Parabolic SAR
The Parabolic SAR was introduced by Wilder in his seminal book, New Concepts in Technical Trading Systems. Its primary purpose is to help traders identify potential trend reversals and manage stop-loss orders effectively. By placing small dots either above or below the price, it creates a visual guide to market direction, making it one of the simplest yet powerful tools in technical analysis.
Understanding the Parabolic SAR
The Parabolic SAR offers a straightforward approach to analyzing market trends. Its key features include:
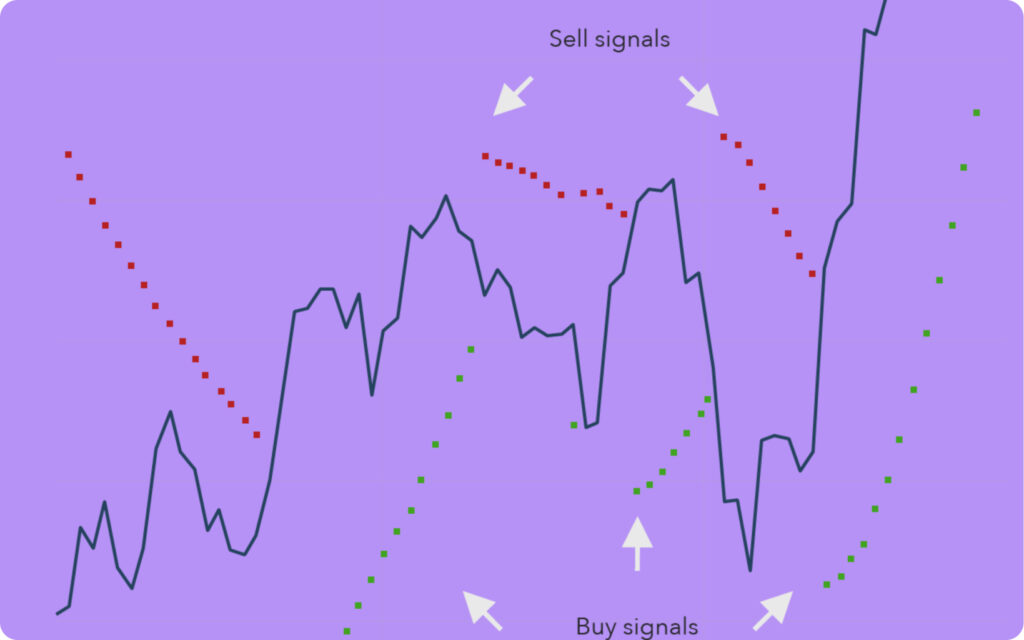
Stop and Reverse Points: These dots pivot from above to below the price, signaling potential trend reversals.
Trade Entry and Exit Signals:
Dots below the price indicate a bullish trend and potential buy signals.
Dots above the price suggest a bearish trend and potential sell signals.
Momentum Analysis:
Accelerating dots moving further from the price indicate a strong trend.
Decelerating dots signal potential consolidation or range-bound conditions.
Trailing Stop Targets: The dots serve as a trailing stop guide, helping traders secure profits while following a trend.
How to Trade with the Parabolic SAR
Traders leverage this indicator in various ways:
Trend Identification: Use the position of dots relative to the price to determine market direction.
Entry and Exit Timing: Follow the dots for clear signals to enter or exit trades.
Risk Management: Incorporate the dots as trailing stop levels to protect against adverse price moves.
Benefits and Drawbacks of the Parabolic SAR
Benefits:
Simplicity: Easy to understand and use for traders of all levels.
Trend Tracking: Helps identify strong trends and signals reversals.
Visual Clarity: Provides a straightforward visual guide for decision-making.
Drawbacks:
False Signals in Ranges: It can produce inaccurate signals in range-bound markets.
Lack of Volume Consideration: It doesn’t factor in other elements like trading volume, which can result in suboptimal trade entries or exits.
Despite its limitations, the Parabolic SAR remains a highly effective tool when used alongside other technical indicators.
At thePropTrade, we integrate this indicator into our trading strategies to complement other tools like the MACD (learn more about it here). By combining these indicators, we enhance our ability to identify trends, pinpoint optimal entry and exit points, and manage risks effectively across all timeframes and asset classes.
More like this
Trading 101
Main types of trading
This article offers an insight to the different types of trading. Understanding these methods can help traders choose the strategy that best suits their goals and risk tolerance.
Theo M
16 Oct 2024
Trading 101
Trend Lines and Channels
In this article, we explain why trend lines and channels are indispensable tools for traders seeking to understand market direction, confirm reversals, and predict price targets.
Theo M
19 Oct 2024
Trading 101
Introduction to Support and Resistance
This article discusses support and resistance. By understanding how price reacts to these zones, traders can make more informed decisions and better anticipate market behavior.