Indicators - Moving Average Convergence Divergence (MACD)
5 min read
January 19, 2024
Technical indicators are indispensable tools for traders and analysts, helping them interpret market dynamics and make informed decisions. Among the most versatile and widely used indicators is the Moving Average Convergence Divergence (MACD). By combining trend-following and momentum analysis, the MACD provides valuable insights into price movements, making it an essential component of any trader’s toolkit.
The History of the MACD
The MACD was developed by Gerald Appel in 1979 as a trend-following momentum indicator. Its original design was enhanced in 1986 by Thomas Aspray, who added the histogram component, further improving its utility. Unlike many other oscillators, the MACD is unbounded, meaning it has no fixed upper or lower limit, which sets it apart in technical analysis.
Understanding the MACD
The MACD indicator is built on three key components:
The MACD Line: Calculated as the difference between the 12-period and 26-period exponential moving averages (EMAs).
The Signal Line: A 9-period EMA of the MACD line.
The Histogram: Represents the difference between the MACD line and the Signal line.
These components work together to show the relationship between two EMAs and the momentum of price movements.
Interpreting the MACD
The MACD indicator offers several ways to analyze market conditions:
1. Crossovers:
Bullish Signal: When the MACD line rises above the Signal line, indicating upward momentum and a potential buy opportunity.
Bearish Signal: When the MACD line falls below the Signal line, suggesting downward momentum and a possible sell opportunity.
Zero Line Crosses: A cross of the Zero line by the MACD line from above is bullish, while a cross of the Zero line by the MACD line from below is bearish.
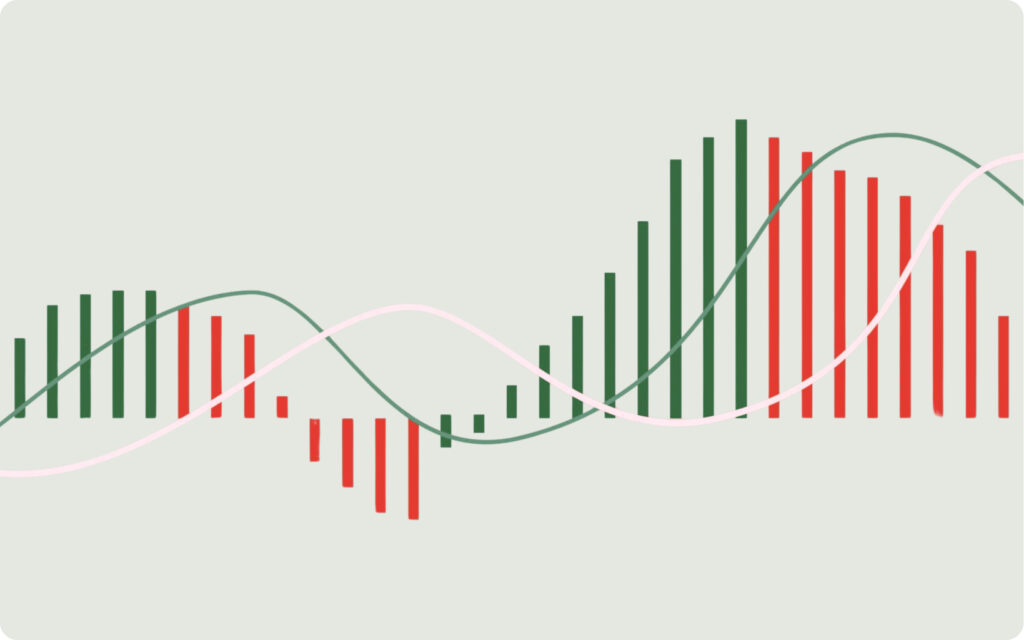
2. MACD Histogram:
The histogram visualizes the distance between the MACD line and the Signal line. Key points to note:
Convergence: When the MACD and Signal lines move closer, the histogram height decreases, signaling a potential trend change.
Divergence: A widening histogram often reflects a strong trend, either upward or downward.
3. Divergences:
Divergences occur when price movements differ from the MACD’s momentum signals. It might signal a trader to get out of a long or short position before profits erode.
Bearish Divergence: The MACD suggests a price decline, but the price continues upward, signaling a potential reversal.
Bullish Divergence: The MACD indicates a price rise, while the price continues downward, hinting at a possible bottoming.
Applications of the MACD
Traders use the MACD for various purposes, such as:
Identifying Trend Momentum: Evaluating whether the market is gaining or losing strength.
Spotting Reversals: Using crossovers and divergences to anticipate changes in market direction.
Enhancing Entry and Exit Points: The MACD helps confirm trade timing in conjunction with other indicators.
At thePropTrade, we incorporate the MACD into our trading strategies to validate trends, detect reversals, and optimize trade execution across all timeframes and asset classes.
More like this
Trading 101
Main types of trading
This article offers an insight to the different types of trading. Understanding these methods can help traders choose the strategy that best suits their goals and risk tolerance.
Theo M
16 Oct 2024
Trading 101
Trend Lines and Channels
In this article, we explain why trend lines and channels are indispensable tools for traders seeking to understand market direction, confirm reversals, and predict price targets.
Theo M
19 Oct 2024
Trading 101
Introduction to Support and Resistance
This article discusses support and resistance. By understanding how price reacts to these zones, traders can make more informed decisions and better anticipate market behavior.