
Financial markets often appear chaotic, but patterns consistently emerge over time. Just as history repeats itself, market trends follow identifiable structures. Fractals are one such recurring pattern that traders use to detect potential reversals and key price levels. The Fractal Indicator is a valuable tool that simplifies market analysis, helping traders interpret price movements efficiently.
Understanding the Fractal Indicator
The Fractal Indicator is a dynamic support and resistance tool that identifies reversal points in the market. It highlights key psychological resistance levels and signals potential trend shifts.
Fractals come in two types:
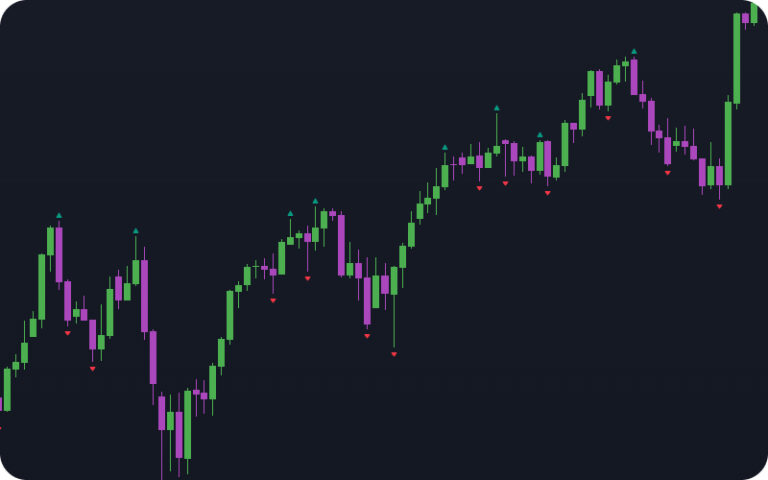
- Up Fractals (Bearish Reversal Signal) – Formed when a five-candle pattern has the highest high at its center. This suggests a potential shift from an uptrend to a downtrend.
- Down Fractals (Bullish Reversal Signal) – Formed when a five-candle pattern has the lowest low at its center. This signals a possible shift from a downtrend to an uptrend.
Both up and down fractals help traders identify key market turning points and plan their trades accordingly.
How to Trade with Fractals
The Fractal Indicator can be used in both trending and ranging markets across all timeframes. However, higher timeframes tend to provide more reliable signals.
Key trading strategies include:
- Breakouts:
- A break above the latest up fractal may signal a buy opportunity.
- A break below the latest down fractal may signal a sell opportunity.
- Confirmation is Key: Traders must wait for the fifth candle to close before entering a trade, ensuring the fractal pattern is fully formed.
Using Fractals with Other Indicators
While fractals can be used as a standalone indicator, their accuracy improves when combined with other technical tools, such as:
- RSI (Relative Strength Index): Helps confirm overbought and oversold conditions.
- Fibonacci Retracements & Extensions: Identifies key levels for potential reversals.
- Moving Averages: Provides additional trend confirmation.
By integrating fractals with complementary indicators, traders can enhance their market analysis and improve decision-making.
Benefits and Drawbacks of Fractals
Benefits:
- Identifies Trend Reversals Early – Provides clear entry and exit points.
- Works Across Multiple Timeframes – Suitable for scalping, day trading, and swing trading.
- Can Be Used in Any Market Condition – Effective in trending and ranging markets.
Drawbacks:
- Lagging Confirmation – The pattern requires five completed candles before confirmation.
- False Signals in Choppy Markets – Best used with additional indicators for validation.
At thePropTrade, we incorporate the Fractal Indicator alongside other technical tools to refine trade entries and maximize profit potential. By recognizing fractal-based breakouts and confirmations, we enhance precision in both trend-following and mean-reverting strategies.