Technical analysis offers traders a variety of tools to interpret market behavior and make strategic decisions. Among these tools, Bollinger Bands, created in the early 1980s by John Bollinger, stand out as a versatile indicator for analyzing price volatility and identifying trading opportunities. By providing a dynamic range based on price action, this indicator is favored by both trend-following and mean-reversion traders.
The History
John Bollinger, a technical analyst, introduced Bollinger Bands in the early 1980s as a method to measure market volatility. Over the decades, they have gained popularity for their ability to adapt dynamically to market conditions, making them a trusted tool for traders worldwide.
Understanding Bollinger Bands
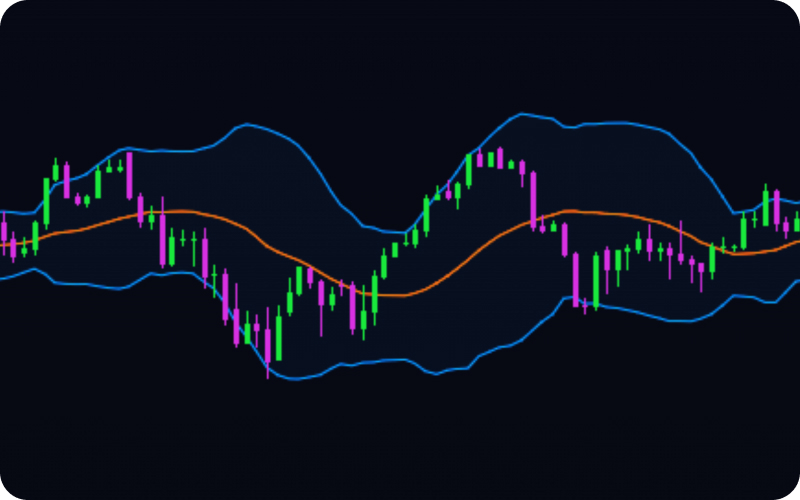
Bollinger Bands consist of three key lines:
- The Middle Line: A 20-period simple moving average (SMA) of the asset’s price.
- The Upper Band: Two positive standard deviations above the middle line.
- The Lower Band: Two negative standard deviations below the middle line.
This setup encompasses 95% of price action within a statistically defined range, offering traders a clear view of the market’s highs, lows, and averages.
How does it work?
1. Trend Analysis:
- Bullish Signals: Price action above the middle line within an upward-sloping band indicates a bullish trend.
- Bearish Signals: Price action below the middle line within a downward-sloping band suggests a bearish trend.
- Horizontal Bands: Represent market consolidation.
2. Overbought and Oversold Conditions:
- Upper Band: Indicates overbought levels, suggesting potential price reversals downward.
- Lower Band: Suggests oversold levels, signaling possible upward reversals.
However, traders must use additional indicators to confirm these signals, as reaching the bands does not guarantee a reversal.
3. Breakouts and Volatility:
- A breakout beyond the bands often signals heightened volatility and the potential for a strong directional move.
- A “Bollinger Band Squeeze,” where the bands narrow significantly, indicates low volatility and the possibility of an explosive move when the price breaks out.
Using Bollinger Bands in Trading
Traders use Bollinger Bands for various purposes, including:
- Identifying Market Direction: Using band slopes and price action relative to the middle line.
- Spotting Entry and Exit Points: Evaluating overbought/oversold levels for potential reversals.
- Assessing Volatility: Observing band width to gauge market conditions (wide bands = high volatility, narrow bands = low volatility).
At thePropTrade, we incorporate Bollinger Bands into our strategies to identify turning points, validate trends, and navigate both trending and ranging markets effectively.
Benefits and Drawbacks
Benefits:
- Dynamic Adaptation: Adjusts to market volatility in real-time.
- Versatility: Suitable for trend-following and mean-reversion strategies.
- Visual Simplicity: Easy-to-read structure for traders of all levels.
Drawbacks:
- False Signals: Can produce misleading signals in highly volatile or range-bound markets.
- Not a Standalone Tool: Must be used alongside other indicators for confirmation.
When combined with additional analysis, Bollinger Bands remain a powerful tool for understanding price dynamics and making informed trading decisions.