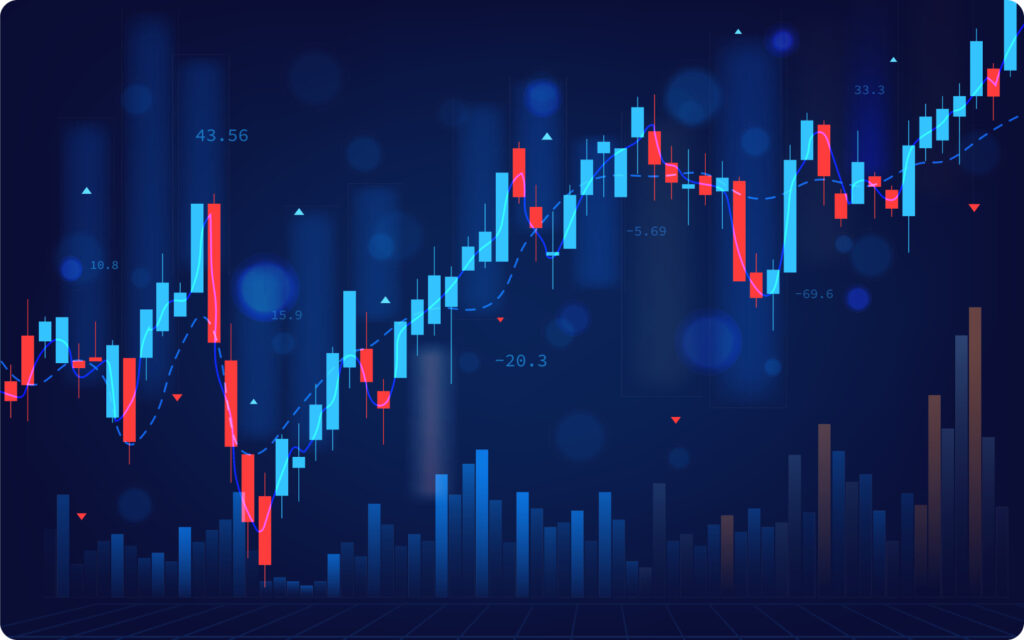
Candlestick charts are a widely-used tool in technical analysis, offering traders valuable insights into market sentiment and price movements. They provide a clear visual representation of price data within a specific timeframe. Over time, various patterns have emerged, helping traders interpret market trends, potential reversals, and overall price action.
Candlesticks
Candlesticks are one of the most popular methods for visualizing price movements on a chart. Other chart types include bar charts, line charts, Heikin Ashi, Renko, and Kagi, but candlesticks are favored for their clarity and depth of information. Given their popularity, this article focuses on candlestick charting and its applications.
The origins of candlestick charting can be traced back to Japan in the mid-1700s. Before this period, rice was primarily traded in local markets, but following the unification of Japan, a centralized national market was established. This development laid the foundation for technical analysis in Japan. By the early 1700s, merchants began trading rice coupons instead of physical rice, marking the creation of the first futures contract market. Munehisa Homma, a renowned Japanese rice trader, documented his trading strategies in two books. These writings formed the basis for modern candlestick charting and the Heikin Ashi technique. Homma’s success in applying these methods made him one of Japan’s wealthiest traders.
Candlestick Anatomy
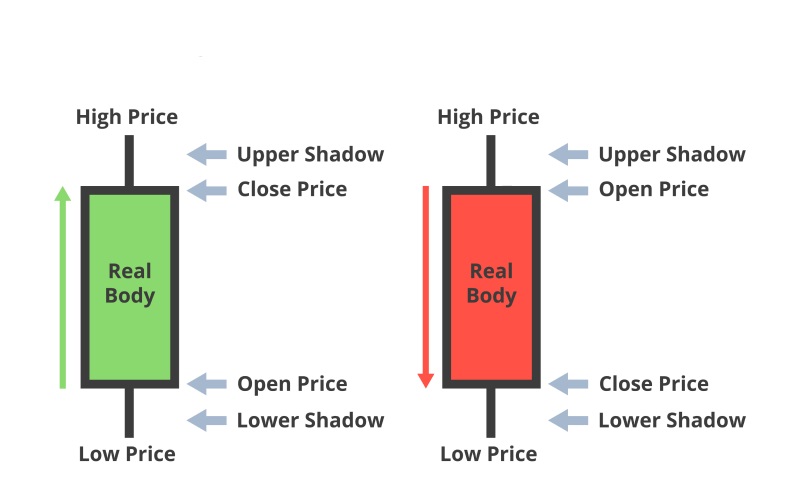
Candlesticks provide a detailed snapshot of price movements within a specific timeframe. A single candlestick is made up of the following elements:
Open and Close: These represent where the price began and ended within a particular trading session, forming the body of the candlestick.
Shadows or Wicks: These lines above and below the body represent the highest and lowest prices reached during the session but not sustained. If no shadows are present, it indicates that the price did not move beyond the opening and closing levels.
In general, if the Open is lower than the Close, the candlestick is bullish (indicating upward movement), while if the Open is higher than the Close, it is bearish (indicating downward movement).
Each candlestick represents a specific timeframe. For instance, on a 30-minute chart, each candle represents 30 minutes of trading activity. The chosen timeframe significantly impacts a trader’s strategy. For example:
Longer timeframes (e.g., daily or weekly charts) are often used by swing traders, who hold positions for weeks or months.
Shorter timeframes (e.g., 30 minutes or 1 hour) are commonly used by day traders, who close all positions within the same trading day.
It’s important for traders to wait for a candle to fully close before making trading decisions, as price action can change significantly before the session ends.
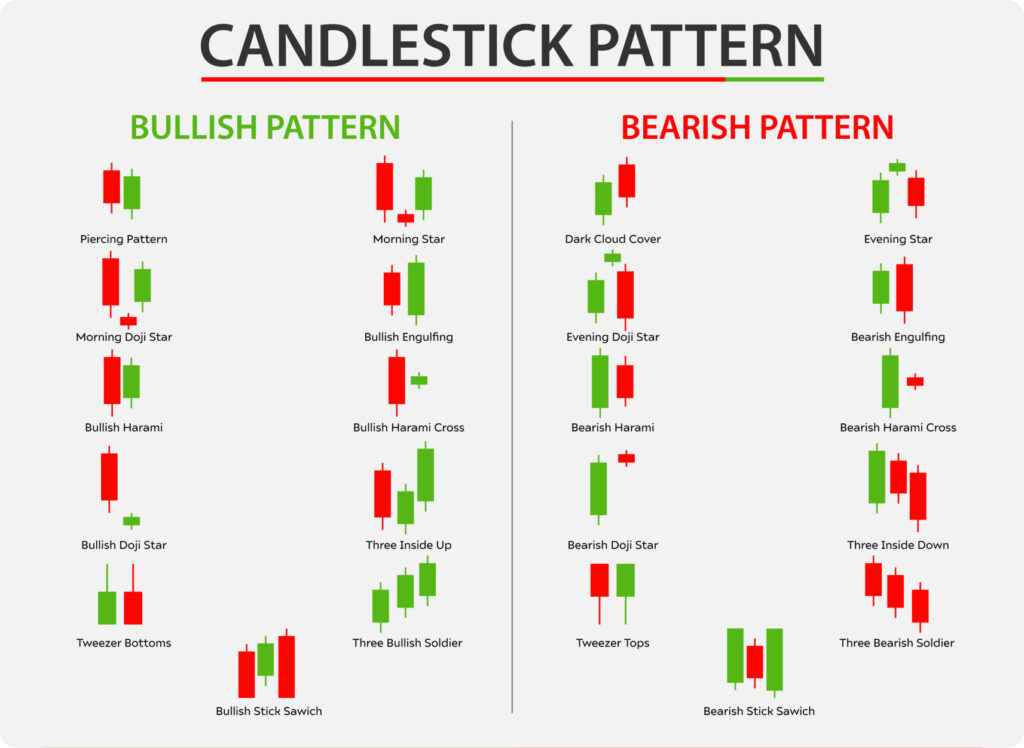
Candlestick Patterns
Candlesticks often form patterns that traders use to interpret and predict future price movements. While there are many patterns, here are a few of the most important:
Hammer / Shooting Star
These patterns are the inverse of each other. A Hammer appears at the bottom of a downtrend and suggests a potential reversal to the upside. Conversely, a Shooting Star appears at the top of an uptrend and signals a possible downturn. Both patterns have small bodies and long shadows, and their significance increases with the length of the shadow. The key characteristics are:
The shadow should be at least twice the size of the body.
There should be little to no shadow on the opposite side of the body.
The candle appears at the end of a trend, indicating a potential reversal.
Engulfing Pattern
The Engulfing Pattern consists of two candles with opposite-colored bodies. The second candle completely engulfs the body of the first, signaling a potential trend reversal. The key elements are:
The second candle’s body must completely cover the body of the first candle, though it does not need to engulf the shadows.
The second candle is the opposite color of the first.
The market should have a clear direction (either an uptrend or downtrend) before the pattern appears.
Doji Star
A Doji Star is a candlestick where the Open and Close prices are almost identical, creating a star-like appearance with equal upper and lower shadows. This pattern can signal indecision in the market and often precedes a potential reversal. However, on its own, the Doji Star is not considered a strong signal. Traders usually watch the price action following a Doji Star closely for confirmation.
Tweezers
The Tweezers pattern is a reversal signal that gains importance when it occurs at the end of a significant trend, whether upward or downward. Key features include:
Two or more candles with either equal highs or equal lows.
The candles can have different shapes, and their bodies or shadows can form the pattern.
The candles may appear consecutively or near each other on the chart.
Context and Importance of Patterns
The significance of these patterns is enhanced when they occur at key market levels, such as near previous support and resistance zones, Fibonacci retracement levels, or other important price points. However, traders should not rely on candlestick patterns alone when making trading decisions. It is best to combine them with other forms of analysis, such as trend lines, technical indicators, or fundamental insights, to increase the reliability of potential trades.
More like this
Trading 101
Main types of trading
This article offers an insight to the different types of trading. Understanding these methods can help traders choose the strategy that best suits their goals and risk tolerance.
Theo M
16 Oct 2024
Trading 101
Trend Lines and Channels
In this article, we explain why trend lines and channels are indispensable tools for traders seeking to understand market direction, confirm reversals, and predict price targets.
Theo M
19 Oct 2024
Trading 101
Introduction to Support and Resistance
This article discusses support and resistance. By understanding how price reacts to these zones, traders can make more informed decisions and better anticipate market behavior.