At thePropTrade, our mission goes beyond offering the rewards from trading on the simulated capital—we strive to educate and empower our community with the tools and knowledge needed to trade with confidence. In our latest educational webinar, long-time trader Stuart unpacks one of his favourite tools in technical analysis: Fibonacci retracements and extensions.
If you’ve ever wondered how Fibonacci fits into modern trading strategies—or questioned why it continues to play such a major role in technical setups—this session is for you.
Why Fibonacci Matters in Trading
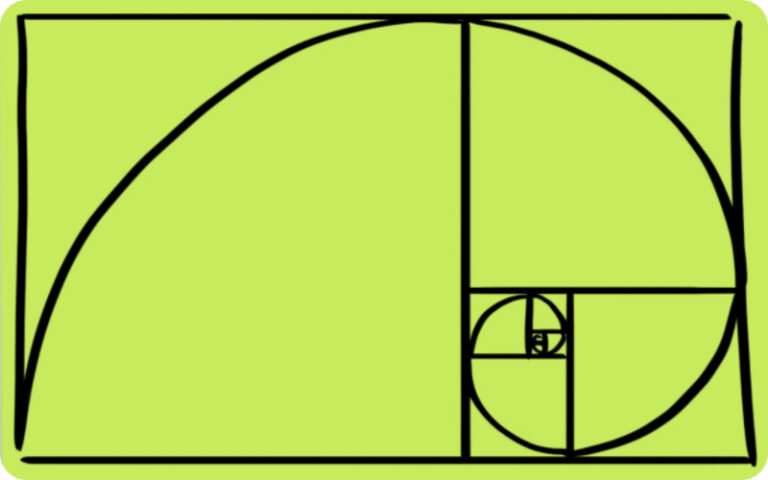
Fibonacci isn’t just a trading buzzword—it’s a mathematical sequence deeply rooted in nature, design, and growth patterns. From the spiral of a seashell to the structure of the human body, Fibonacci’s sequence (0, 1, 1, 2, 3, 5, 8, 13…) reveals a fascinating rhythm of proportions that also appears—perhaps surprisingly—on price charts.
In trading, Fibonacci is most commonly used to:
- Identify potential retracement levels in trending markets
- Set logical price targets and stop-loss areas
- Find zones of support and resistance where price may pause or reverse
- Layer confidence when combined with other tools like moving averages or MACD
While some critics argue it’s too subjective, Stuart makes a compelling case for Fibonacci as a practical and repeatable framework—especially when used with discipline and awareness of its limitations
Retracements: Timing the Pullback in a Trend
One of the most common uses of Fibonacci in trading is the retracement tool—used to gauge how far a price might pull back before continuing in its original trend.
According to Stuart, Fibonacci retracement is only valid when there’s a clear trend that has already ended. You can’t measure a pullback until it’s underway. This is a critical point often overlooked by beginners who try to “predict” reversals too early.
The most widely used retracement levels are:
- 38.2%
- 50% (not part of the original Fibonacci sequence but widely accepted)
- 61.8% — known as the “golden ratio”
These levels represent psychological zones where traders may step in—either to take profits or to rejoin the trend at a more favorable price.
Stuart emphasizes that retracement tools work best when used after a trend leg is clearly over—not mid-move. A premature application can lead to false assumptions and poorly timed entries.
Extensions and Expansions: Targeting the Next Move
Once a trend resumes after a retracement, traders can use Fibonacci extensions (also known as expansions) to project future price targets. These are especially useful for setting take-profit levels or gauging how far a breakout may run.
In an uptrend, the extension levels beyond 100% help estimate how far price may travel after breaking a recent high. In a downtrend, they offer guidance on where price might fall after breaking a recent low.
Key extension levels include:
- 138.2%
- 161.8%
- 261.8%
- 423.6% (less common, but useful in parabolic or volatile moves)
Stuart demonstrates how extensions, when paired with recent highs and lows, can map out surprisingly accurate price zones—especially when aligned with other technical signals.
Clustering and Coalescence: Where Fibonacci Becomes Powerful
One of the most advanced concepts Stuart explores is clustering—when multiple Fibonacci levels from different trend legs overlap at or near the same price zone. This convergence significantly strengthens the relevance of those levels.
Why does this matter? Because the more confirmation a level has, the more likely it is to act as meaningful support or resistance.
For example, if a 50% retracement of one move aligns with a 61.8% level from a separate swing, and that area coincides with a psychological round number like 1.5000—that price becomes a high-probability decision zone for both retail and institutional traders.
Clustering is where Fibonacci becomes more than just a set of horizontal lines—it becomes part of a larger confluence-based trading strategy.
Final Thoughts & Key Takeaways
Stuart puts it best—“Fibonacci fascinated me from the very beginning, and the way it integrates into technical analysis opened my eyes.” While it doesn’t work every time (nothing does), Fibonacci offers a structured way to interpret market behavior through the lens of probability and pattern.
The Key takeaways are:
- Fibonacci is not predictive, but it is powerfully reactive.
- Always identify a clear trend and a completed leg before applying Fib tools.
- The 61.8% level often plays a pivotal role in both retracements and extensions.
- Clustering of multiple Fib levels offers enhanced confidence.
- Fibonacci works best as part of a broader toolkit, not in isolation.
Have questions or want to discuss your setups? Join the conversation on our Discord server, or reach out directly—we’re here to support your journey.