
Support and resistance are fundamental concepts in technical analysis, representing critical areas where supply and demand dynamics can influence price movements. When plotted on a chart, these levels become clearer and offer traders valuable insights into potential price behavior. Understanding how price reacts at these levels helps traders anticipate market movements, although it’s important to consider these zones as areas of interest rather than definitive triggers for trading. Other factors and technical indicators should also be taken into account before making any trading decisions.
What Is Support?
Support refers to a price level where demand is strong enough to prevent further decline. In other words, it’s an area where buyers step in, considering the asset’s price to be undervalued or at a fair value. This causes the downtrend to pause or reverse, as buying pressure exceeds selling pressure.
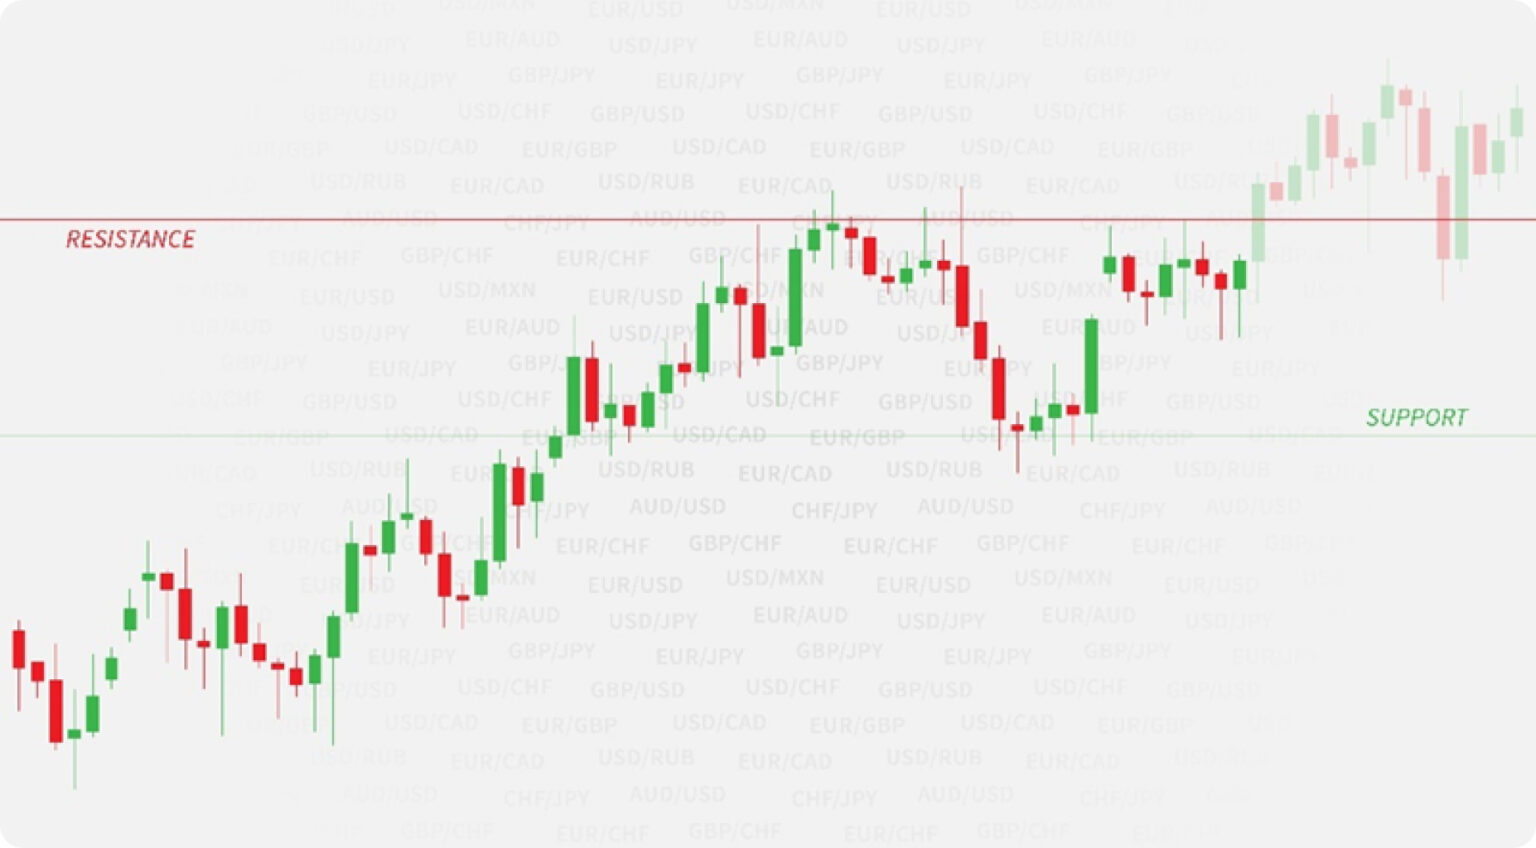
- Example from the Chart: As shown in the image, when the price reaches the green support level, it stabilizes, indicating that there are more buyers than sellers at this price level. If the price falls below this support, it could indicate a shift in market sentiment, and this level could then act as future resistance.
It’s essential to note that once a support level is broken, it often turns into a resistance zone in future price action. This shift reflects the market’s change in sentiment, where former buyers may now become sellers, pushing prices down if they attempt to recover to this level.
What Is Resistance?
Resistance represents a price level where selling pressure is strong enough to prevent the price from rising further. At this level, more sellers enter the market, deeming the asset overvalued or at a fair price, which results in a pause or reversal of the upward trend.
- Example from the Chart: The red resistance level in the image shows where the price repeatedly faces difficulty breaking through, signaling that sellers consider this price too high. If the price eventually breaks above this resistance, it could become a support level in the future, reflecting a potential shift in market psychology.
When resistance is breached, it often leads to a rapid price increase as sellers are forced to cover their positions, while new buyers enter the market, expecting the price to rise further.
Price Behavior at Support and Resistance Levels
When price approaches a support or resistance zone, several key scenarios can unfold, depending on the balance between buyers and sellers. Understanding these scenarios allows traders to anticipate potential price movements more effectively.
1. Rejection
A rejection occurs when the price reaches a support or resistance level but fails to break through it, leading to a reversal. For instance, at a resistance level, traders who bought at lower prices might start selling to lock in profits, while new traders may open short positions, expecting the price to fall. If selling pressure outweighs buying pressure, the price will be rejected and start falling from the resistance level. The opposite occurs at support, where buying pressure exceeds selling pressure, causing the price to rise.
- Trader’s Tip: Rejection is often confirmed by candlestick patterns such as shooting stars, doji, or engulfing patterns, which signal that the market is reversing direction. Traders should watch for these patterns before entering trades and may consider placing stop-loss orders just beyond the support or resistance levels to manage risk.
2. Breakout
A breakout happens when the price decisively breaks through a support or resistance level, often leading to a sharp price movement. At resistance, a breakout occurs if the number of traders willing to hold or open long positions outweighs those selling or shorting. This leads to a surge in price as traders who bet against the resistance are forced to cover their positions (i.e., buying to exit shorts), pushing the price even higher. Similarly, when price breaks below support, it signals that selling pressure is overwhelming buying interest, triggering a downward move.
- Trader’s Tip: Watch for high trading volume during a breakout, as this confirms that the breakout is likely to sustain. False breakouts, where price quickly reverses after crossing support or resistance, can trap traders. Therefore, it’s crucial to ensure that the breakout is supported by momentum, indicated by increased volume or follow-through price action.
3. Consolidation
Consolidation occurs when the price stalls near a support or resistance level, moving sideways within a tight range. This period of indecision indicates that buyers and sellers are in relative equilibrium. Traders holding long positions might be hesitant to sell, while others are waiting for a clearer direction. The market may consolidate for some time before making a decisive move in either direction.
- Trader’s Tip: During consolidation, price tends to form chart patterns like triangles or rectangles, which can help traders anticipate the next move. A breakout from a consolidation pattern typically results in a sharp move, as traders react quickly once the price escapes the narrow range. The longer the consolidation, the more explosive the breakout can be, so traders should be prepared for heightened volatility once the price breaks out.
Why Support and Resistance Are Crucial in Trading
Understanding support and resistance is essential for all traders. These levels help traders:
- Identify Entry and Exit Points: Support and resistance levels are key areas where traders look to enter or exit positions. For instance, traders might buy near support and sell near resistance to maximize profit potential.
- Manage Risk: By placing stop-loss orders below support levels or above resistance levels, traders can manage risk more effectively, limiting potential losses if the market moves against them.
- Confirm Trends: Breakouts above resistance or below support are key signals that a trend is continuing or reversing. Monitoring these levels provides valuable insight into the strength of the current trend.
- More like this

Trading 101
Trend Lines and Channels
In this article, we explain why trend lines and channels are indispensable tools for traders seeking to understand market direction, confirm reversals, and predict price targets.
Theo M
23 Oct 2024

Trading 101
Brief introduction to candlestick analysis
In this article, we’ll explore the anatomy of candlesticks, key patterns, and how they can be applied to improve trading decisions.
Theo M
17 Oct 2024

Trading 101
Main types of trading
This article offers an insight to the different types of trading. Understanding these methods can help traders choose the strategy that best suits their goals and risk tolerance.
Theo M
16 Oct 2024